Introduction
Hello everyone! In this post, I’d like to share my journey of building a secure API management platform from the ground up. This project was an exciting opportunity for me to dive deep into coding a functional API using Go, implementing multiple endpoints, and deploying the application securely with modern cloud-native tools. My focus was on user authentication, API key management, and enhancing observability to create a robust and secure platform.
Throughout this journey, I leveraged a suite of technologies: Go for the API development, PostgreSQL for data storage, Docker and Docker Compose for containerisation, Jenkins for continuous integration, and tools like Trivy and SonarQube for code quality and security. Deployment was managed with Kubernetes and Helm charts, while observability was enhanced using OpenTelemetry, Prometheus, and Grafana. Additionally, I utilised Swagger for API documentation and Jaeger for distributed tracing.
I’m excited to walk you through the process, from coding the API and implementing endpoints to deploying the application. By the end of this post, you’ll have a comprehensive understanding of how these technologies come together to build and deploy a secure API management platform.
Technologies Used
- Go: Chosen for its simplicity and excellent concurrency support, making it ideal for building scalable and high-performance APIs.
- PostgreSQL: A reliable relational database used to store user data, API keys, and other critical information.
- Docker: Containerised the application for consistent deployment across various environments.
- Docker Compose: Orchestrated multi-container setups, simplifying the management of services like the API, database, and monitoring tools.
- Helm: Kubernetes package manager that simplifies the deployment and management of the application manifests.
- Kubernetes: Provided a scalable platform for deploying and orchestrating the containerised application.
- OpenTelemetry (OTEL): Instrumented the application to collect and expose metrics for enhanced observability.
- Prometheus: Monitored application metrics, enabling real-time data collection and powerful querying capabilities.
- Grafana: Visualised metrics through customisable dashboards to monitor application performance and health.
- Swagger: Generated interactive API documentation for exploring and testing endpoints.
- Jaeger: Implemented distributed tracing to monitor and debug request flows and identify performance bottlenecks.
- Jenkins: Automated the CI/CD pipeline for efficient and reliable application building, testing, and deployment.
- Trivy: Scanned Docker images for vulnerabilities to ensure security before deployment.
- SonarQube: Analysed code quality, detecting bugs and vulnerabilities to maintain high coding standards.
Building the API
Project Structure
Organising the project effectively was crucial for maintainability and scalability. Here’s how I structured it:
/cmd: This directory contains the entry point for the application, where the main function is defined. It initialises the server and sets up routing and middleware./pkg: This directory holds reusable packages such asauth,database, andhandlers. These packages encapsulate specific functionalities and are used throughout the application./configs: This directory contains configuration files, including database settings and environment variables./docs: This directory includes Swagger/OpenAPI documentation files, which are auto-generated to provide a comprehensive overview of the API endpoints.
Implementing Endpoints
I implemented the endpoints using Go’s Gin framework, which I found excellent for its simplicity and performance. Gin’s middleware support made it easy to integrate authentication and metrics collection.
Setting Up the Router
router := gin.Default()

// Public routes
router.POST("/auth/register", registerHandler)
router.POST("/auth/login", loginHandler)

// Protected routes
authorised := router.Group("/")
authorised.Use(AuthMiddleware())
{
    authorised.GET("/users/me", getProfileHandler)
    authorised.DELETE("/users/:id", deleteUserHandler)
    authorised.POST("/api-keys", createAPIKeyHandler)
    authorised.GET("/api-keys", listAPIKeysHandler)
    authorised.DELETE("/api-keys/:id", revokeAPIKeyHandler)
}

// Health check
router.GET("/health", healthCheckHandler)

// Metrics
router.GET("/metrics", prometheusHandler)
Middleware
Middleware was essential for handling cross-cutting concerns:
- Authentication Middleware: Verified JWT tokens to secure protected routes.
- API Key Middleware: Allowed users to authenticate using API keys for programmatic access.
- Metrics Middleware: Collected request performance data for observability.
Error Handling Strategy
I prioritised clear and user-friendly error messages. By using structured error responses, clients receive informative feedback on issues like invalid input or unauthorised access, enhancing the overall user experience.
API Endpoints Overview
/health
- Functionality: Checks the application’s health status.
- Usage: Returns a simple status message, useful for monitoring tools.

/auth/register
- Functionality: Registers a new user.
- How it Works: Accepts a JSON payload, validates input, hashes the password, and stores user info in PostgreSQL.
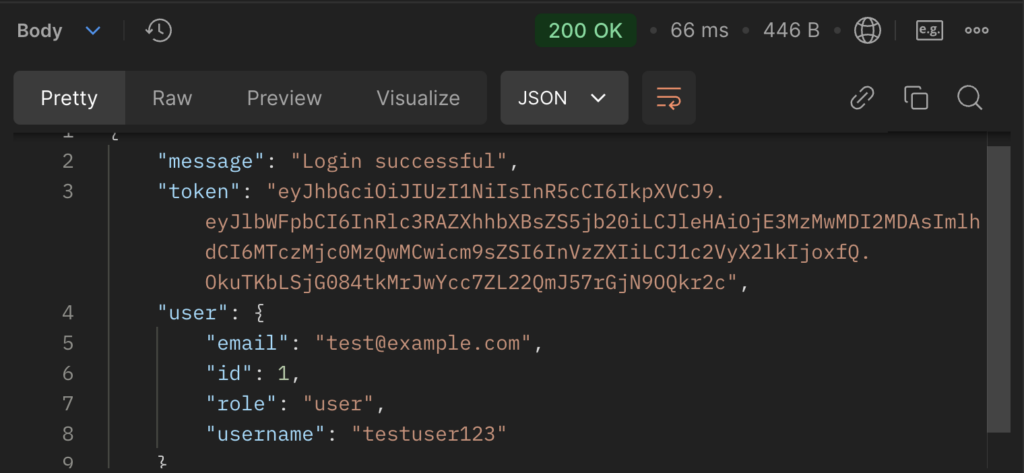
/auth/login
- Functionality: Authenticates a user and issues a JWT token.
- How it Works: Validates credentials and generates a JWT token upon success.

/auth/logout
- Functionality: Logs out a user by invalidating their JWT token.
- How it Works: Adds the token to a blacklist to prevent further use.
/users/me
- Functionality: Retrieves the current user’s profile.
- How it Works: Uses the JWT token to fetch user data, excluding sensitive information.
/users/{id}
- Functionality: Deletes a user account (admin-only).
- How it Works: Checks the user’s role from the JWT token and deletes the specified account if authorised.
/api-keys
- Functionality: Manages API keys.
- How it Works: Allows users to generate, list, and revoke API keys, with all actions securely logged.

/api/test
- Functionality: A test endpoint for verifying API Key functionality.
- How it Works: It can be used to test the API key response and behaviour.

/metrics
- Functionality: Exposes application metrics for Prometheus.
- How it Works: Provides metrics data at
/metrics, which Prometheus scrapes for monitoring.
Deploying the API
Deploying the application was a significant part of the project, and I explored two primary strategies:
1. Docker Compose Deployment
Objective: Provide a quick and efficient setup for local development and testing.
Setup Overview:
- Docker Compose orchestrates multiple services required by the application.
- Services include the API, PostgreSQL, Swagger UI, Jaeger, Prometheus, and Grafana.
- All services are defined in a single
docker-compose.ymlfile for simplicity.
docker-compose.yml Snippet:
version: '3.8'

services:
  app:
    build: .
    ports:
      - "8080:8080"
    environment:
      - DB_HOST=postgres-db
      - DB_PORT=5432
      - POSTGRES_USER=postgres
      - POSTGRES_PASSWORD=postgres
      - POSTGRES_DB=apisecurity
    depends_on:
      - postgres-db
    networks:
      - app-network

  # Additional services like PostgreSQL, Prometheus, Grafana, etc.

networks:
  app-network:
    driver: bridge
2. CI/CD Deployment with Jenkins and Helm Charts
Objective: Achieve scalable, production-grade deployments suitable for cloud environments.
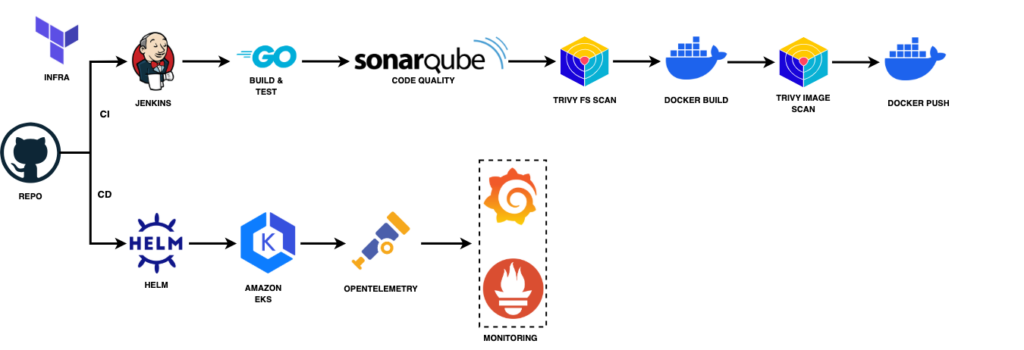
CI/CD Pipeline Overview:
- Jenkins automates the build, test, and deployment processes.
- Pipeline Steps:
- Code Checkout: Jenkins pulls the latest code from the repository.
- Build: Compiles the Go application.
- Static Code Analysis: Runs SonarQube scans for code quality.
- Containerisation: Builds Docker images.
- Security Scanning: Uses Trivy to scan images for vulnerabilities.
- Push to Registry: Stores the Docker image in a container registry.
- Deployment: Uses Helm charts to deploy to Kubernetes.
Helm Charts:
- Defined Kubernetes resources like Deployments, Services, and ConfigMaps.
- Made the deployment configurable and repeatable across different environments.

Monitoring and Observability with Prometheus and Grafana
Ensuring the application is observable was a key objective. Here’s how I set up monitoring:
Exposing Metrics with OpenTelemetry
- Instrumentation: Used OpenTelemetry SDKs to instrument the application code.
- Metrics Endpoint: Exposed a
/metricsendpoint providing Prometheus-compatible metrics.
Configuring Prometheus
- Scrape Configuration:
scrape_configs:
  - job_name: 'api-security-platform'
    static_configs:
      - targets: ['app:8080']
metrics_path: '/metrics'- Function: Prometheus scrapes the
/metricsendpoint at regular intervals.
Visualising Metrics with Grafana
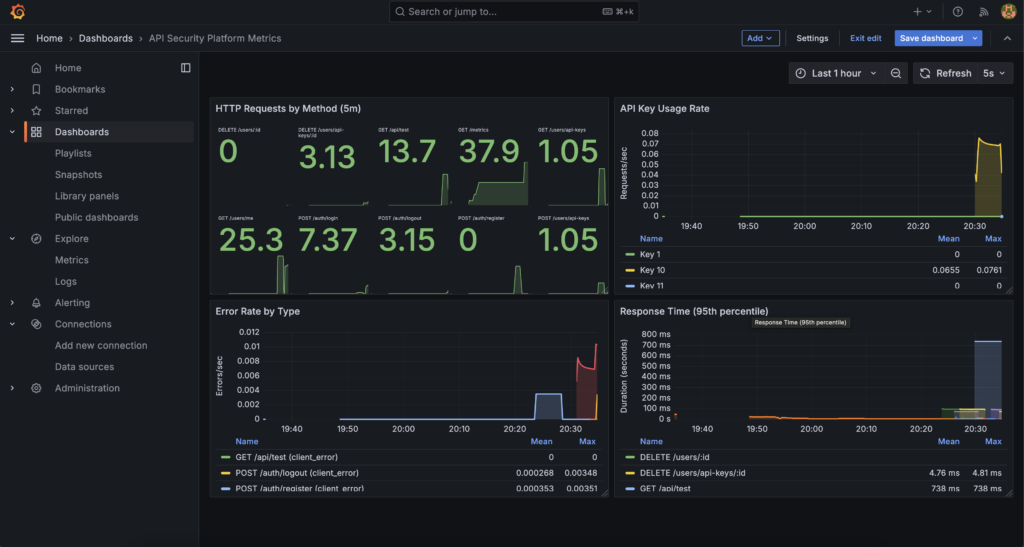
- Dashboards: Created custom Grafana dashboards to visualise key metrics.
- Key Insights:
- Request Rates: Monitored traffic patterns.
- Success and Error Rates: Tracked application reliability.
- Performance Metrics: Analysed latency and resource utilisation.

Challenges and Lessons Learned
Handling JWT Tokens
- Challenge: Implementing secure JWT-based authentication with role-based access control.
- Solution: Used the
jwt-golibrary to generate and validate tokens, including user roles and expiration times.
Securing API Keys
- Challenge: Storing and validating API keys without compromising security.
- Solution: Hashed API keys using bcrypt before storage and implemented middleware to validate incoming keys securely.
Integrating OpenTelemetry
- Challenge: Ensuring comprehensive and meaningful metrics collection.
- Solution: Carefully instrumented the application using OpenTelemetry’s conventions for metrics, traces, and logs.
By navigating these challenges, I enhanced the platform’s security, reliability, and observability, ensuring it meets the needs of both developers and users.
Conclusion
Building this secure API management platform was a rewarding experience that deepened my expertise in DevOps, DevSecOps, and platform engineering. Here’s a quick recap:
- Functional API Development: Leveraged Go and Gin to build a high-performance API with robust authentication and user management features.
- Secure and Scalable Deployment: Utilised Docker, Kubernetes, and Helm to ensure the application is deployable in various environments with scalability and reliability.
- Enhanced Observability: Implemented comprehensive monitoring with Prometheus and Grafana, and used Jaeger for distributed tracing to gain insights into application performance.
I invite you to explore the GitHub repository to dive into the code and perhaps even deploy the platform yourself. Your feedback and thoughts are welcome!
Keywords: DevOps, DevSecOps, Site Reliability Engineering, SRE, Platform Engineering, Go, Kubernetes, Docker, API Security, Monitoring, Observability.
Femi Akinlotan
DevOps and cloud engineering expert. I forge cutting-edge and resilient solutions at DevOps Foundry. I specialize in automation, system optimization, microservices architecture, and robust monitoring for scalable cloud infrastructures. Driving innovation in dynamic digital environments.


